Happening Now
The Round Three LD Map Is OUT!
February 16, 2024
By Jim Mathews / President & CEO
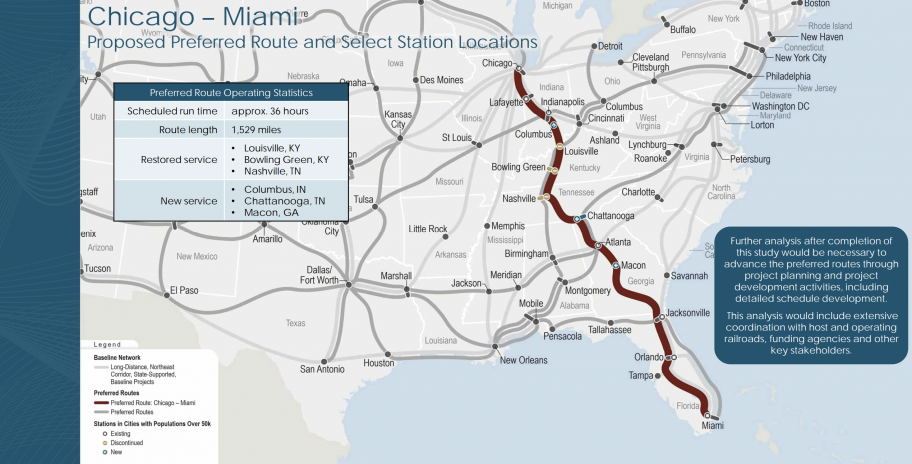
OK, OK, Twitter leaks be gone! The actual map of Federal Railroad Administration preferred new long-distance routes proposed for further study was just released moments ago – 15 new routes on top of Amtrak’s existing network, with a few quick wins but to be built out in full over several decades.
You can click here to download all 163 pages of meeting materials we reviewed last week and this week. Your job as interested citizens and advocates is to review the materials, and offer constructive, fact-based feedback on how the routes are put together, what kinds of continuing planning should be done, and whether and how an independent entity should be created to ensure that as these route projects unfold the served communities continue to have a voice in making sure they really happen.
You have until March 8th to review the materials and then draft and submit your feedback to the study team using the email address [email protected]. Remember, constructive, fact-based, specific observations and suggestions are the way to go here. Some 5,000 comments have been reviewed to date, and comments truly did help shape the final routings selected by the FRA team.
 If this map is fully realized, 89 percent of the U.S. population would have access to Amtrak trains, including 19 million more Americans in the most-populated metropolitan areas. In this plan some 13 million Americans who lost service to the various Amtrak cuts over the years would get it back. This new map would add 102 stations in rural communities, nearly doubling service in rural areas.
Tribal areas would see 112 percent more access, and for people living in what the Dept. of Transportation defines as “health-disadvantaged areas” – that is, areas with poor access to medical facilities and hospitals – there would be 66 percent greater access. Five million people without good medical access could get it via this new map, which would ensure that 86 percent of all U.S. medical centers are served.
Military training centers and historically black colleges and universities (HBCUs) would also find themselves served on this map. And it probably doesn’t hurt that instead of today’s 251 congressional districts with Amtrak service, the new map would touch 431.
A few items you should regard with extra caution: the routes’ statistics are reported on a PER MILE basis. So when the map says something like “Travel Demand: 85,” what it means is 85,000 trips per mile of the route – or some 15.7 million trips each year flowing along the New York to Dallas/Fort Worth’s endpoints and intermediate stops. Be sure you know what you're reacting to before you write.
Now it’s your turn! Read, analyze, draft, and comment by March 8th. Go!
"The support from the Rail Passengers Association, and from all of you individually, has been incredibly important to Amtrak throughout our history and especially so during the last trying year."
Bill Flynn, Amtrak CEO
April 19, 2021, speaking to attendees at the Rail Passengers Virtual Spring Advocacy Conference
Comments