Happening Now
Delays, Ridership, All Rise In FY 23 Fourth Quarter
January 19, 2024
By Jim Mathews / President & CEO
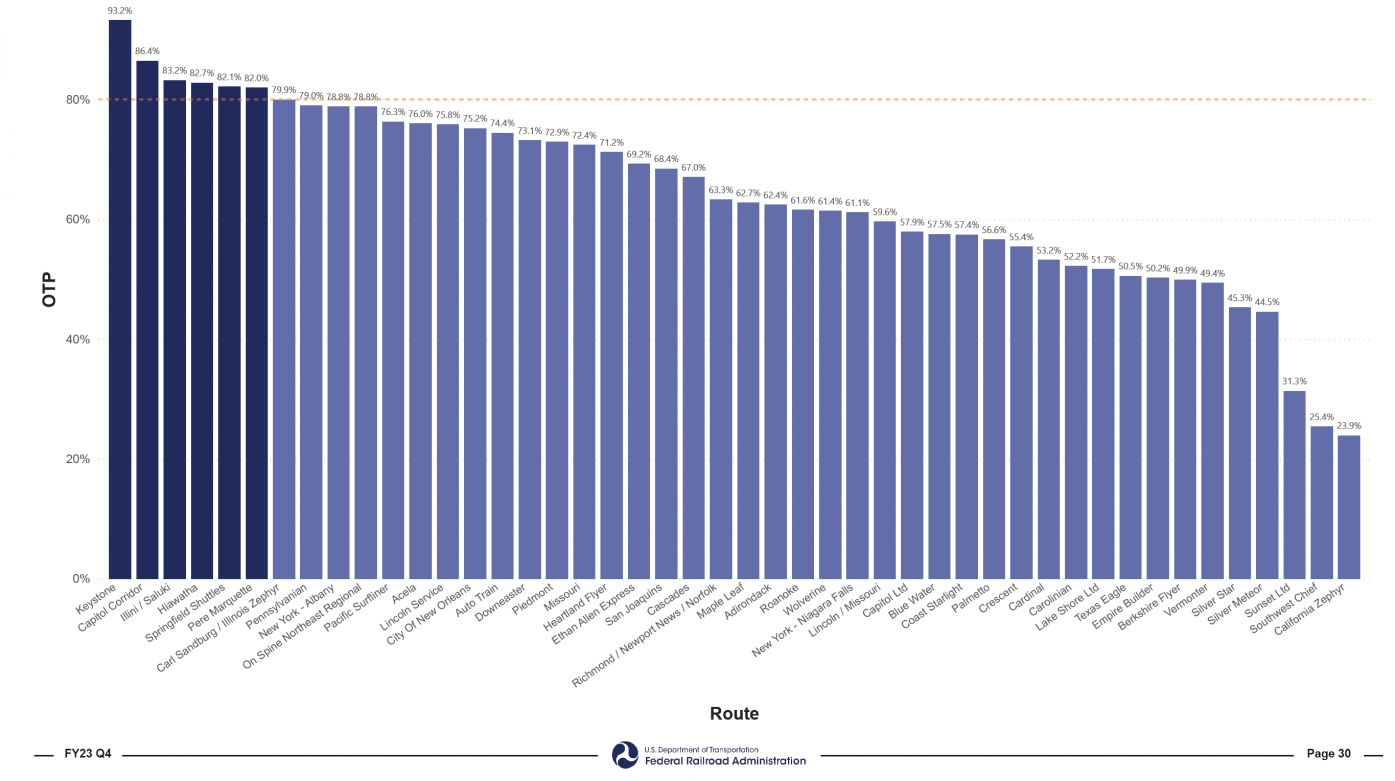
Federal Railroad Administration data for passenger-train delays and customer service standards are out for the fourth quarter of fiscal 2023, and – surprise! – delays got worse, freight-train interference remained the biggest driver, and the only trains in the entire system to reach the 80 percent Customer on-time performance (OTP) standard were state-supported routes.
These reports are the result of the hard-fought two-decades battle to allow FRA to develop metrics and standards to measure passenger-train performance. Those new metrics and standards took effect in 2020 and were reported for the first time in 2021. (Click here to see the story behind getting the new rules in place.)
Every quarter FRA now reports detailed information covering on-time performance, train delay minutes, Amtrak’s financial performance, customer satisfaction scores by route, data on stations, and figures measuring public benefits such as the levels of service to underserved communities, the number of missed connections, the degree to which routes connect other communities, and how many people in large metropolitan statistical areas across the country have access to trains.
 Somewhat surprisingly, given the volume and tenor of complaint emails we get here at the Association, by and large Amtrak’s customers remain relatively happy with, and supportive of, the railroad’s customer service. In the fourth quarter of fiscal 2023, customers rated 36 out of 46 routes at 80 percent or higher customer satisfaction, and no route got less than 70 percent satisfaction ratings.
FRA also reported that ridership was up 18 percent over year-earlier levels, and farebox recovery has come up, too, reaching 83 percent in the fourth quarter of fiscal 2023. That period covers July, August, and September of 2023.
Union Pacific has improved its performance in delaying Amtrak trains lately, but even so the Class I ended the fourth quarter of fiscal 2023 with the largest number of host-responsible delay minutes at 1,376 minutes per 10,000 train miles. And once again, the star performer among host railroads was Canadian Pacific at 692 minutes per 10,000 train miles.
“For each Class I host railroad except for Canadian Pacific, freight train interference comprised the largest number of delay minutes per 10,000 train miles,” FRA noted. “Slow orders caused the most minutes of delay per 10,000 train miles on Canadian Pacific.”
The summary report can be found by clicking on this link. Detailed spreadsheets with data in all the different reporting categories can be found by clicking on this link.
"I wish to extend my appreciation to members of the Rail Passengers Association for their steadfast advocacy to protect not only the Southwest Chief, but all rail transportation which plays such an important role in our economy and local communities. I look forward to continuing this close partnership, both with America’s rail passengers and our bipartisan group of senators, to ensure a bright future for the Southwest Chief route."
Senator Jerry Moran (R-KS)
April 2, 2019, on receiving the Association's Golden Spike Award for his work to protect the Southwest Chief
Comments